QGIS Plugin of the Week: Time Manager
QGIS has a lot of plugins, including over 180 that have been contributed by users. If you aren’t using plugins, you are missing out on a lot that QGIS has to offer. I’m starting what I hope to be a regular feature: Plugin of the Week. This week we’ll take a look at Time Manager.

Time Manager lets you browse spatial data that has a temporal component. Essentially this includes anything that changes location through time. Examples include:
- Wildlife tracking
- Vehicles
- Storm centers
- QGIS users
Data Preparation
Expanding on our last post about QGIS Users Around the World, we’ll use Time Manager to watch access to the QGIS Python plugin repository through time. If you refer to the previous post, you’ll see that all the IP addresses contacting the repository were extracted from the web server log and geocoded to get the approximate geographic coordinates. To use Time Manager all we need is the time for each access to the repository.
A important part (for our purpose) of the web server log entry looks like this:
192.168.1.2 - - [23/Oct/2011:21:17:54 +0000] "GET /repo/contributed HTTP/1.1" 200 256
Time Manager supports date/time in the following formats:
-
YYYY-MM-DD HH:MM:SS
-
YYYY-MM-DD HH:MM
-
YYYY-MM-DD
As you can see, this doesn’t work with the format in the web server log.
The geocoding process created a file containing IP address, country, city (where available), latitude and longitude. This file is used to create a Python dictionary to look up locations by IP address. Using this file and a bit of Python, the web server log entries were converted into a CSV file containing:
    ip,date_time,country,latitude,longitude
    192.168.1.2,2011-10-23 21:13:53,United States,61.2149,-149.258
    192.168.1.2,2011-10-23 21:14:22,United States,61.2149,-149.258
    192.168.1.2,2011-10-23 21:17:54,United States,61.2149,-149.258
    192.168.1.2,2011-10-23 21:18:04,United States,61.2149,-149.258
    ...
The CSV file was first converted to a shapefile using the QGIS Delimited Text plugin. Performance with Time Manager was somewhat slow using a shapefile containing 134,171 locations. The shapefile was imported into a SpatiaLite database (you can do this using ogr2ogr or the SpatiaLite GUI).
Using Time Manager
To display the progression of access to the repository (and thus users of QGIS), we first have to have the Time Manager plugin installed.[1] Once installed, we enable it using the Plugin Manger.
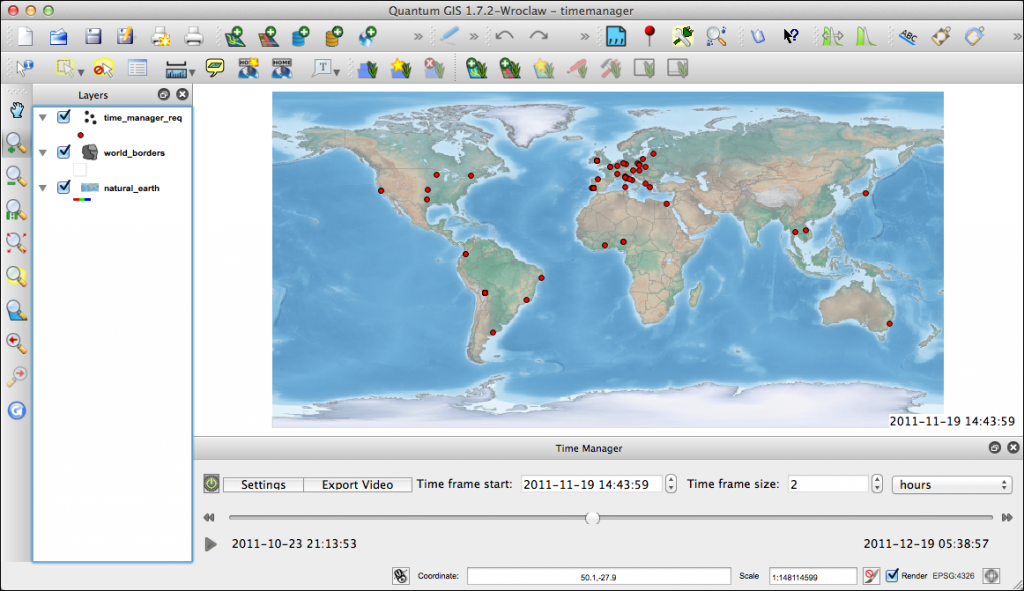
As you can see from the screenshot above, Time Manager installs a new panel in QGIS that sits below the map canvas. You can set a number of options by clicking Settings; the most important being the layer to use in the visualization. For the QGIS users, we use the time_manager_req layer that was created from the web server logs. With the location and date/time data in the proper format, you can click the “Play” button to start the display. For each time interval, the plugin selects the appropriate entries and displays a frame for the duration specified in the settings.
You can use the time slider to move around or move the time interval forward or backward using the buttons on each end of the slider.
A really nice feature is the ability to export to video. At present this saves a PNG file and world file for each time interval. You can then use another software package to combine these to create a video animation of the time sequence. Once solution is to use mencoder[1]:
    mencoder "mf://*.PNG" -mf fps=10 -o output.avi -ovc lavc -lavcopts \
    vcodec=mpeg4
Putting all this together gives us the following visualization of QGIS user activity from October 23 through December 19, 2011:
You can see the “wave” of activity progress from east to west as the daylight hours come and go.
Summary
If you have spatial data with a date or time component, the Time Manager plugin provides a convenient way to visualize the temporal relationships.
