Leaflet Day 7 - Coordinates
In this post, we’ll do a couple of things:
- Clean up the display of coordinate precision in our popups
- Add the current coordinates to the map as the mouse moves
Coordinate Precision Display
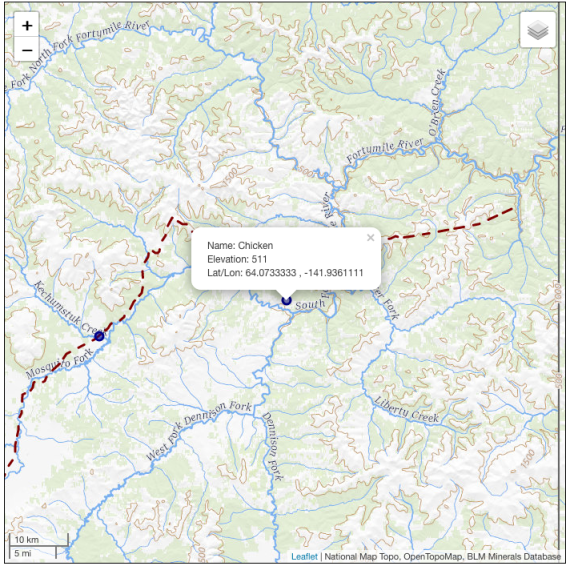
The current map displays the latitude and longitude with seven decimal places. This is more than we need to see when displaying information about locations:
Fixing this is easy to do using the JavaScript function toFixed. Here is a snippet of code from the
trails layer:
onEachFeature: function( feature, layer){
var townName = feature.properties.feature_na;
var elevation = feature.properties.elev_in_m;
var lat = feature.properties.prim_lat_d.toFixed(3);
var lon = feature.properties.prim_lon_1.toFixed(3);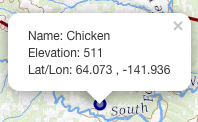 Notice we've added `toFixed(3)` to the latitude and longitude values. This gives us a nicer display
while not altering the data itself:
Notice we've added `toFixed(3)` to the latitude and longitude values. This gives us a nicer display
while not altering the data itself:
If you were observant, you may have noticed that we already did this for the placer mines in our Day 6 post, we just didn't point it out:
  onEachFeature: function( feature, layer){
      var name = feature.properties.mils_deposit_name;
      var elevation = feature.properties.site_pnt_elev_meas;
      var lat = feature.properties.site_lat_dec_meas.toFixed(3);
      var lon = feature.properties.site_long_dec_meas.toFixed(3);
Displaying Coordinates on the Map
Sometimes it’s nice to know where in the world you are. To do that, we’ll add a display of the map coordinates that updates as we move the mouse.
To do this, we need to create a div that is a child of our map div. We also need to style it to setup its location:
var coordDIV = document.createElement('div');
coordDIV.id = 'mapCoordDIV';
coordDIV.style.position = 'absolute';
coordDIV.style.bottom = '0';
coordDIV.style.left = '0';
coordDIV.style.zIndex = '900';

document.getElementById('mapDIV').appendChild(coordDIV)
This sets up our display location to the bottom left of the map. The zIndex of 900 ensures it is displayed on top of everything else.
Next we need to setup the event to do the actual capture and display of the coordinates as the mouse moves.
// Setup the event to capture and display mouse movements
map.on('mousemove', function(e){
var lat = e.latlng.lat.toFixed(3);
var lon = e.latlng.lng.toFixed(3);
document.getElementById('mapCoordDIV').innerHTML = lat + ' , ' + lon;
});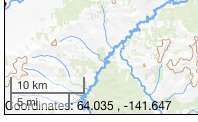 You may have noticed a problem. The coordinate display occupies the same place as the scalebar.
This is because, by default, the scalebar control occupies the lower left corner of the map.
Let's move the coordinate display by adjusting the bottom and left positions:.
You may have noticed a problem. The coordinate display occupies the same place as the scalebar.
This is because, by default, the scalebar control occupies the lower left corner of the map.
Let's move the coordinate display by adjusting the bottom and left positions:.
coordDIV.style.bottom = '1px';
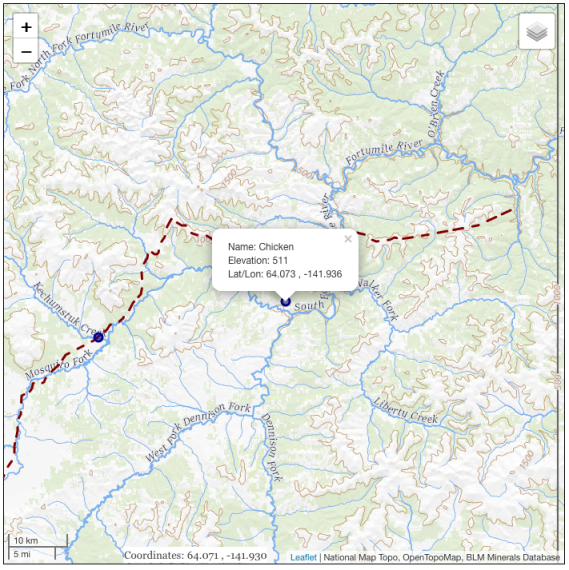
coordDIV.style.left = '150px';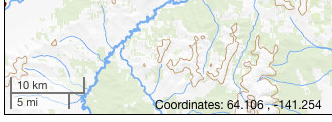 This moves `coordDIV` up 1 pixel and to the right 150px.
It's not clobbering the scalebar anymore, but the font could use a little tweaking. We can do this
by adding to the style setting of the `coordDIV`:
This moves `coordDIV` up 1 pixel and to the right 150px.
It's not clobbering the scalebar anymore, but the font could use a little tweaking. We can do this
by adding to the style setting of the `coordDIV`:
coordDIV.style.color = '#404040';
coordDIV.style.fontFamily = 'Georgia';
coordDIV.style.fontSize = '10pt';
coordDIV.style.backgroundColor = '#fff';
This does a number of things:
- Set the color of the font to a gray shade so it’s not so intrusive
- Change the font to Georgia (just for the fun of it)
- Set the font size to 10 pt
- Change the background color of the div to white so it shows up better on the map
That’s it for the cosmetic face lift to our map.
You can view the map and the HTML source live here.
You can find all the techniques used in the “Two Weeks of Leaflet” posts—and more—in the Leaflet Cookbook.