In this post we’ll switch gears and install Leaflet locally, then add a layer from a GeoPackage file.
Installing Leaflet
Up until now we’ve been using a hosted version of Leaflet. In other words, each
time we load the map, a request is made to fetch the Leaflet CSS and JavaScript.
There are a couple of ways to install Leaflet: download it from the website or
install with npm. In both cases you’ll need to move leaflet.js,
leaflet.css, and the images directory to the appropriate location for your
site.
Once installed, the HTML file needs changed to reflect the location of the
files:
    <link rel="stylesheet" href="/stylesheets/leaflet.css" />
    <script src="/js/leaflet.js"></script>
The images directory resides in the same place as the CSS file.
Using the Plugin
To access GeoPackage layers, we need to use the leaflet-geopackage plugin. We can use it without installing as we did previously with leaflet—using a CDN:
<script src="https://unpkg.com/@ngageoint/leaflet-geopackage@2.0.5/dist/leaflet-geopackage.min.js"></script>
Adding the GeoPackage Layer
The data is a GeoPackage containing past producing placer mines in the area of the Forytmile district. The original source data is from a BLM minerals database. The code to add and style the layer is:
 1
 2
 3
 4
 5
 6
 7
 8
 9
10
11
12
13
14
15
16
17
18
19
20
21
22
|
  var placer = L.geoPackageFeatureLayer([], {
      geoPackageUrl: '/data/fortymile_placer.gpkg',
      layerName: 'placers',
      pointToLayer: function(feature, latlng){
          return L.circleMarker(latlng, {radius: 5,
                                        stroke: false,
                                        fillColor: '#800000',
                                        fillOpacity: 0.6});
      },
      onEachFeature: function( feature, layer){
          var name = feature.properties.mils_deposit_name;
          var elevation = feature.properties.site_pnt_elev_meas;
          var lat = feature.properties.site_lat_dec_meas;
          var lon = feature.properties.site_long_dec_meas;

          layer.bindPopup('Name: ' + name +
                          '<br/>Elevation: ' + elevation +
                          '<br/>Lat/Lon: ' + lat + ' , ' + lon);
          layer.on('mouseover', function() {layer.openPopup();});
          layer.on('mouseout', function() {layer.closePopup();});
      }
  });
|
In lines 1–3, the layer is created by specifying the URL (path) to the GeoPackage file and providing the name of the layer
(placers). The rest of the code (lines 4–22) look pretty much like code for adding the towns.
In the pointToLayer option we styled it a bit differently, removing the stroke (outline) of the circle and providing a dark
red color with 0.6 opacity.
The onEachFeature option looks just like the one for the towns, with the exception of the field names used for the popup.
The placer layer is added to the list of overlays, but initially not visible. When enabled in the layer control, the map looks
like this:
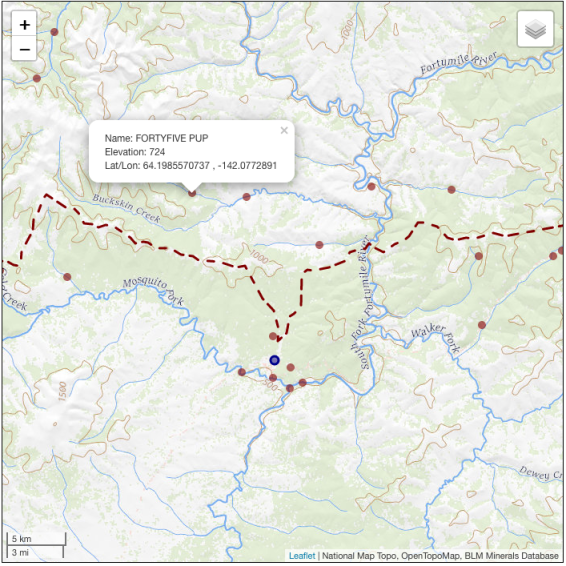
We changed the zoom level and centered the map on the Fortymile area. There are a lot more mines in Alaska, but for the sake of
performance, we filtered them down to only past producing placer mines in the region.
The map doesn’t convey any information
about the current status of any of the mines, just that they were producing at some point in the past.
The Code
Here’s the complete JavaScript code for the map:
 1
 2
 3
 4
 5
 6
 7
 8
 9
10
11
12
13
14
15
16
17
18
19
20
21
22
23
24
25
26
27
28
29
30
31
32
33
34
35
36
37
38
39
40
41
42
43
44
45
46
47
48
49
50
51
52
53
54
55
56
57
58
59
60
61
62
63
64
65
66
67
68
69
70
71
72
73
74
75
76
77
78
79
80
81
82
83
84
85
86
87
88
89
90
91
92
|
var map = L.map(document.getElementById('mapDIV'), {
    center: [64.1, -141.94],
    zoom: 9
});

// Base maps
var basetopo = L.tileLayer('https://basemap.nationalmap.gov/arcgis/rest/services/USGSTopo/MapServer/WMTS/tile/1.0.0/USGSTopo/default/default028mm/{z}/{y}/{x}.png', {});
var baserelief = L.tileLayer('https://tile.opentopomap.org/{z}/{x}/{y}.png', {});

basetopo.addTo(map);

// The trail
var thetrail = L.geoJSON(trail, {
    color: '#800000',
    weight: 3,
    dashArray: '12 8 12',
});

thetrail.bindTooltip('The Valdez-Eagle Trail')
thetrail.addTo(map);


var towns = L.geoJSON(trail_stops,
                      {pointToLayer: function(feature, latlng){
                          return L.circleMarker(latlng, {radius: 5,
                                                         color: '#00008b',
                                                         fillOpacity: 0.5});
                      },
                      onEachFeature: function( feature, layer){
                          var townName = feature.properties.feature_na;
                          var elevation = feature.properties.elev_in_m;
                          var lat = feature.properties.prim_lat_d;
                          var lon = feature.properties.prim_lon_1;


                          layer.bindPopup('Name: ' + townName +
                                          '<br/>Elevation: ' + elevation +
                                         '<br/>Lat/Lon: ' + lat + ' , ' + lon);
                          layer.on('mouseover', function() {layer.openPopup();});
                          layer.on('mouseout', function() {layer.closePopup();});
                      }
                     });

towns.addTo(map);

var placer = L.geoPackageFeatureLayer([], {
    geoPackageUrl: '/data/fortymile_placer.gpkg',
    layerName: 'placers',
    pointToLayer: function(feature, latlng){
        return L.circleMarker(latlng, {radius: 5,
                                       stroke: false,
                                       fillColor: '#800000',
                                       fillOpacity: 0.6});
    },
    onEachFeature: function( feature, layer){
        var name = feature.properties.mils_deposit_name;
        var elevation = feature.properties.site_pnt_elev_meas;
        var lat = feature.properties.site_lat_dec_meas.toFixed(3);
        var lon = feature.properties.site_long_dec_meas.toFixed(3);


        layer.bindPopup('Name: ' + name +
                        '<br/>Elevation: ' + elevation +
                        '<br/>Lat/Lon: ' + lat + ' , ' + lon);
        layer.on('mouseover', function() {layer.openPopup();});
        layer.on('mouseout', function() {layer.closePopup();});
    }


});


var baselayers = {
    'Shaded Relief': baserelief,
    'National Map topo': basetopo
};
var overlays = {
    'The Trail': thetrail,
    'Towns': towns,
    'Placer Mines': placer
};
L.control.layers(baselayers, overlays).addTo(map);

// Add scalebar

var scale = L.control.scale()
scale.addTo(map)

// Add attribution
map.attributionControl.addAttribution('National Map Topo');
map.attributionControl.addAttribution('OpenTopoMap');
map.attributionControl.addAttribution('BLM Minerals Database');
|
You can view the map and the HTML source live
here.
You can find all the techniques used in the “Two Weeks of Leaflet” posts—and more—in the Leaflet Cookbook.