QGIS Plugin of the Week: Profile
This week we take a look at a how to plot a terrain profile using the Profile plugin. The plugin can be used with any raster format supported by QGIS. You can can display profiles from up to three rasters at once, allowing you to compare the results. To illustrate, we’ll create a simple profile using a DEM of a 1:63,360 quadrangle in Alaska.
Installing the Plugin
The Profile plugin is installed like all other Python plugins. From the the Plugins menu in QGIS, choose Fetch Python Plugins. This brings up the plugin installer. To find the plugin, enter profile in the Filter box, then select Profile from the list. Once it’s highlighted, click the Install plugin button. This will download the plugin from the repository, install it, and load it into QGIS.[1]
Using the Plugin
Here we have loaded the DEM as well as a raster (DRG) of the topography for the same quadrangle and zoomed in a bit to an area of interest:
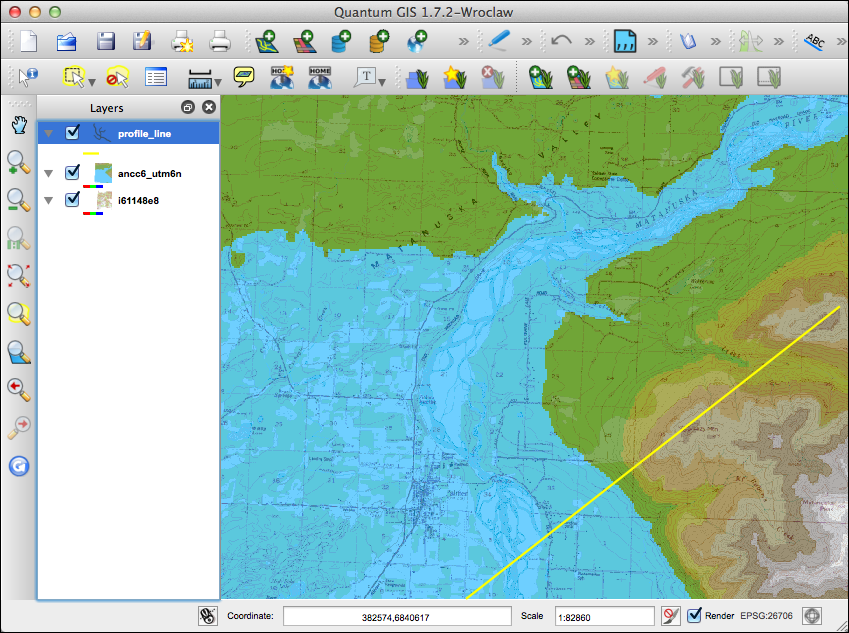
The yellow line has been added to indicate where we will take the profile. While the Profile plugin allows you to interactively select the profile line it doesn’t display the line on the map.
To create a profile, first make sure the raster you want to profile is selected in the layer list, then activate the plugin from the Plugins toolbar by clicking on it. The cursor becomes a cross that you use to create the profile line: click at the start point, move to the end and click again. Once you have created the profile line, the plugin pops up the result:
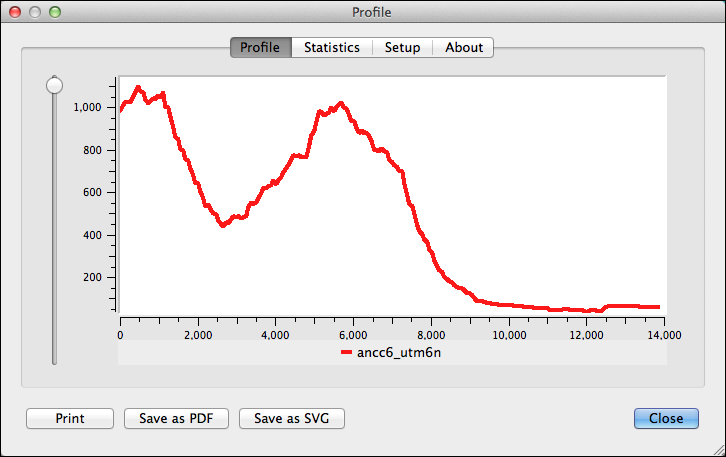
The profile is taken from the northeast towards the southwest, based on where we clicked first. You can change the exaggeration of the profile by using the slider on the left. The X axis shows the distance along the profile line in map units and the Y axis shows the cell values from the raster—in this case, elevation in meters.
You can save the result as a PDF or SVG using the buttons at the bottom of the dialog.
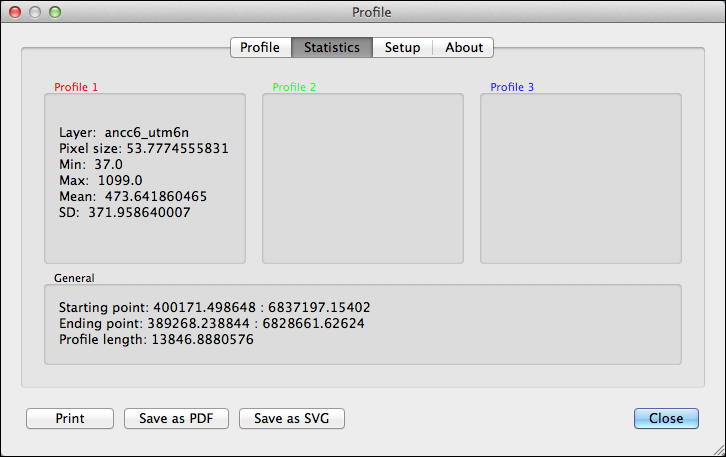
The Statistics tab displays some information for the raster layer and the profile line:
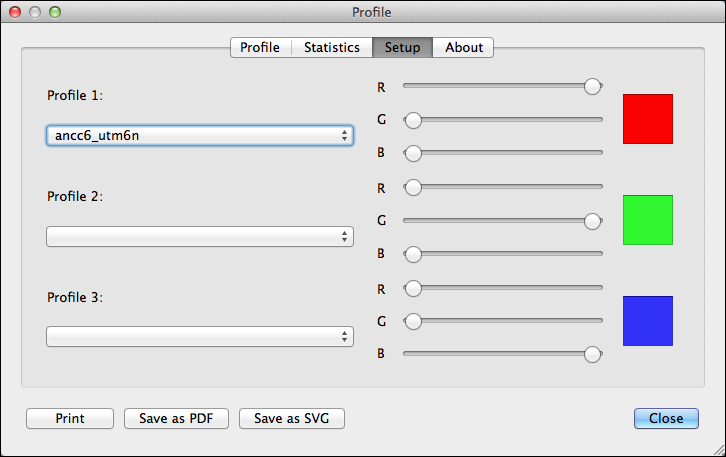
If we had additional rasters loaded, we could use the Setup tab to add them to the profile analysis. This would display the results using the colors specified for each layer and we could compare them on the Profile tab.
This is just one of several QGIS plugins that deal with profiles. You can check out the rest of them using the Python Plugin installer.
[1] The Profile plugin requires the Python module for QWT5. If you don’t have this installed, a warning will be displayed during the installation process.