QGIS Plugin of the Week: Points to Paths
This week we highlight the Points to Paths plugin, a handy way to convert a series of points into line features. This plugin lets you “connect the dots” based on an common attribute and a sequence field. The attribute field determines which points should be grouped together into a line. The sequence field determines the order in which the points will connected. The output from this plugin is a shapefile.
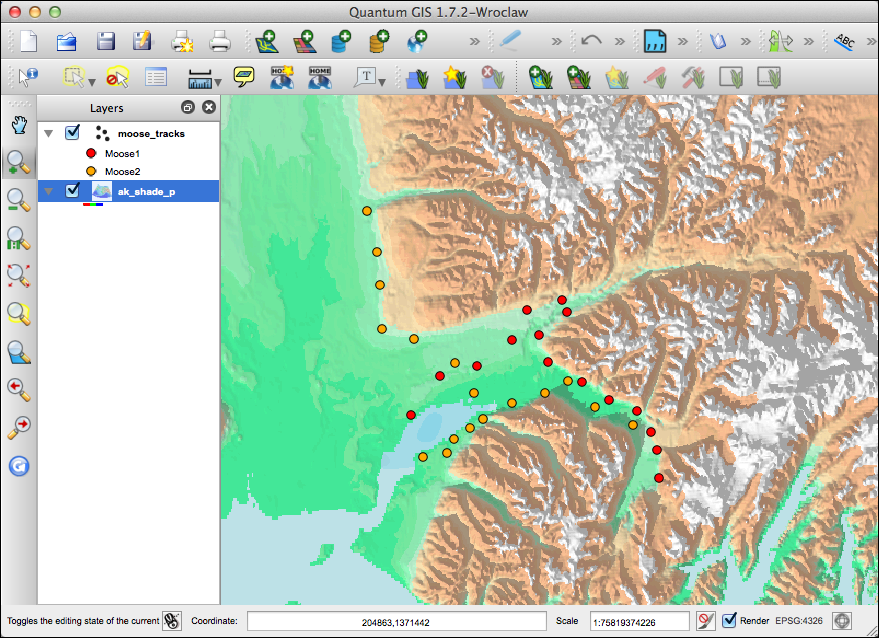
Let’s take a look at some example data. Here we have some fictional wildlife tracking data for two moose. The tracking data is in shapefile format, but you can use any vector format supported by QGIS. The tracking data is symbolized by our two animals: Moose1 and Moose2:

The moose_tracks layer has an animal tracking id field (animal_tid) and a sequence field (id). This is all we need to convert the individual observations into a line feature that represents the animals path.
Installing the Plugin
The Points to Paths plugin is installed like all other Python plugins. From the the Plugins menu in QGIS, choose Fetch Python Plugins. This brings up the plugin installer. To find the plugin, enter points to in the Filter box, then select Points to Paths from the list. Once it’s highlighted, click the Install plugin button. This will download the plugin from the repository, install it, and load it into QGIS.
Using the Plugin
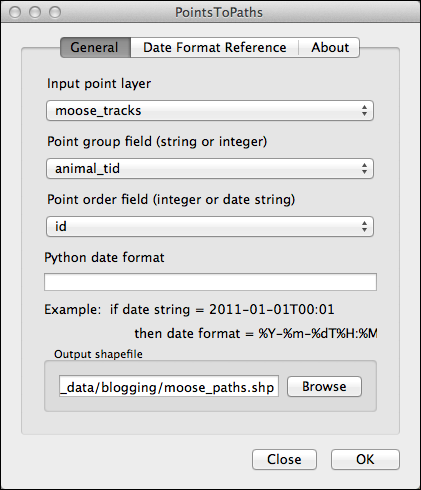
Let’s convert the tracking data to paths. To get started, choose Plugins->Points to Paths from the menu or click on the Points to Paths tool on the Plugin toolbar. This brings up the PointsToPaths dialog box where we specify the paramaters needed to create the paths. Below is the completed dialog for our moose tracks:

The first drop-down box contains a list of the vector layers loaded in QGIS—in our case we have just one: moose_tracks. For the group field drop-down we chose the field that contains the tracking identifier for each animal. This determines which points will be selected and grouped to form an individual line. The point order field drop-down specifies the field that contains the ordering for the observations. In this case, the id field is incremented with each observation and can be used to construct the paths. We don’t have a date/time field in this data, but your observations may be sequenced in this way. The Python date format field allows you to specify a format string so the plugin can determine how to sequence your points based on date/time.
The last thing we need to specify is the output shapefile. You can do this by typing in the full path to a new shapefile or by using the Browse button.
With these options set, clicking the OK button will create the new shapefile containing the paths created from our point observations. Once the shapefile is created, the plugin gives you the option to add the new shapefile directly to QGIS.
The Result
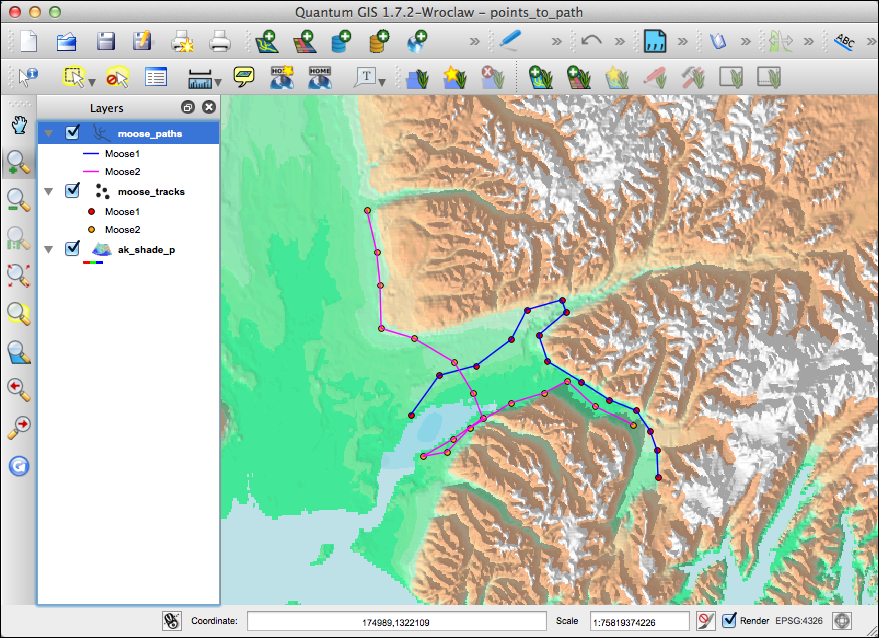
The result of our simple example are shown below:

We symbolized the individual tracks using the Categorized renderer on the Style tab of the vector properties dialog. You can see we now have a track for each animal. The attribute table created by the plugin contains the following fields:
-
group - the name of the animal taken from the field we chose as the group field
-
begin - the value of the first point order field used to create the path
-
end - the value of the last point order field used to create the path
In our data, group contains the animal name, begin the value of the lowest id field for animal, and end contains the greatest id value. In a more typical data set, begin and end would contain the start and end date/time values for the observation. Labeling the observation points with our sequence field or date/time values would allow us to determine the direction of movement.
If you have point data that represent a movement of an object, this plugin is a great way to convert it into a path that can be used for visualization, analysis, or map composition.
